In this blog, you will learn to visualize live data streams in real time, all within the comfort of your favorite tool, the Jupyter Notebook.
In most projects, dynamic charts within Jupyter Notebooks need manual updates; for example, it may require you to hit reload to fetch new data to update the charts. This…
The capacity of infographics to strategically arrange and use visual signals to clarify complicated concepts has made them essential for efficient communication. Infographics include various visual elements such as charts, diagrams, illustrations, maps, tables, and document layouts. This has been a long-standing technique that makes the material easier to understand. User interfaces (UIs) on desktop…
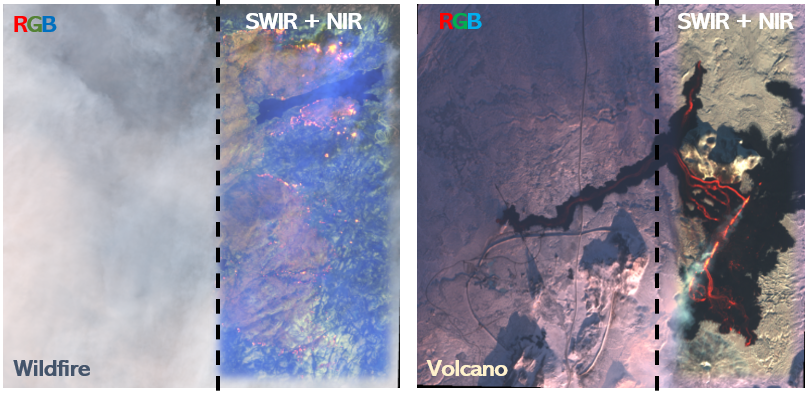
Visualizing satellite images captured over volcanos and wildfires in various spectral bands Sentinel-2 images captured over a volcano and a wildfire visualized with different spectral bands by the author🌟 Introduction 🔍 Sentinel-2 (Spectral Bands) 🌐 Downloading Sentinel-2 Images ⚙️ Processing Sentinel-2 Images (Clipping and Resampling) 🌋 Visualization of Sentinel-2 Images (Volcano) 🔥 Visualization of Sentinel-2…
In the bustling world of business, managing accounts payable and invoice processing manually is becoming more and more challenging. The challenges are numerous: painstakingly slow manual data entry ever-present risk of human error lack of efficiency in the approval process Businesses are constantly seeking ways to streamline these critical operations. Today, AP automation…
Image generated with DALLE-3
In the ever-evolving landscape of technology, the data revolution emerges as a formidable force, reshaping the fabric of industries, economies, and societal norms. Data science and machine learning are at the heart of this transformative surge, serving as crucial catalysts for innovation. They propel us into an era where…
Using OpenAI’s Clip model to support natural language search on a collection of 70k book covers In a previous post I did a little PoC to see if I could use OpenAI’s Clip model to build a semantic book search. It worked surprisingly well, in my opinion, but I couldn’t help wondering if it would…
The travel industry often struggles with long processing times at check-in and security, causing congestion. Manual verification of IDs and travel documents is time-consuming. Immigration officers have difficulty quickly validating identities and spotting fraudulent documents when manually reviewing visas and passports. Airlines endure tedious data entry work extracting information from paper tickets and forms, increasing…
Image by Author
Profiling Python code is helpful to understand how the code works and identify opportunities for optimization. You’ve probably profiled your Python scripts for time-related metrics—measuring execution times of specific sections of code.
But profiling for memory—to understand memory allocation and deallocation during execution—is just as important. Because memory profiling can…
An accessible walkthrough of fundamental properties of this popular, yet often misunderstood metric from a predictive modeling perspective Photo by Josh Rakower on UnsplashR² (R-squared), also known as the coefficient of determination, is widely used as a metric to evaluate the performance of regression models. It is commonly used to quantify goodness of fit in…
Optical character recognition (OCR) software help convert non-editable document formats such as PDFs, images, or paper documents into machine-readable formats that are editable & searchable. OCR applications are commonly used to capture text from PDFs & images and convert the text into editable formats such as Word, Excel, or a plain text file. OCR…